Why Use Words When You Can Use Pictures?
What exactly is an infographic?
- An infographic is a way to deliver information to the viewer, but mostly through photos rather than words.
There are many apps available in order to make an infographic in an easy way, among these are Venngage, Canva, which I've previously used, and Piktochart. Considering I've used Canva previously, I decided I'd attempt to broaden my horizons and try a new app. Although both Venngage and Piktochart seemed equally efficient, Piktochart appeared simpler. This could be due to it's graphics, or simply the layout of the app. Regardless, I decided to download the app.

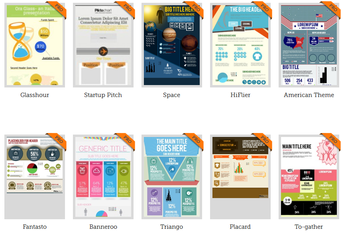
Piktochart is free in the app store, but only for the "create your own" infographics. In order to use one of their many colorful templates, you must pay.
The Piktochart iPad app comes along with the essential functions to create, download and publish your visuals.
Features:
• Select your favorite templates and create infographics, posters, presentations, and reports.
• Edit your existing visuals
• Save your visuals to your account
• Download and publish your visuals, and share it through email or to your favorite social media platforms, including Facebook, Twitter, Google+, and Pinterest
• Present your published presentations with our built-in Presentation mode
• Visit the featured infographic gallery so you never run out of ideas
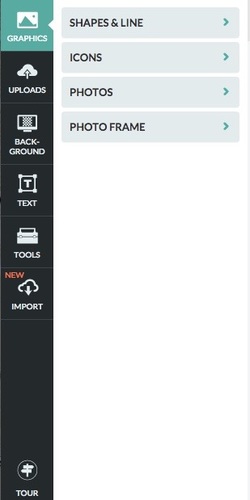
• Use customizable elements including texts, shapes, icons, and photos!
Although there are less options when it comes to layouts on the app, the "create your own" option allows for more creativity. The categories are simply organized into a drag and place format. The simplicity of the layers makes this app an easy way to learn about layers, therefore could be a good way to progress toward using more complicated programs such as Adobe Photoshop.
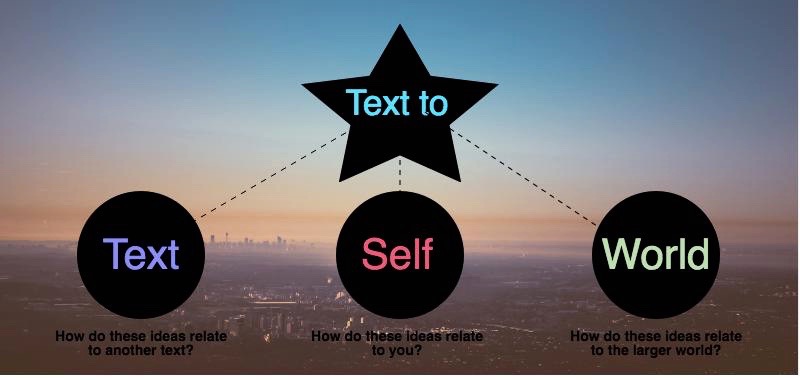
For my first infographic, I infused an English related lesson. It could have been much more complicated and harder to grasp if I'd tried to put it all into words, however, using an infographic makes it more memorable, and easier to grasp. I could use this in an English classroom in order to teach students how to summarize. Because it limits the amount of words that can be added while keeping the factor of interest in mind, it'll teach the students to learn how to pick out what is the most interesting information, and how to portray it in an easy-to-interpret way.


